Introduction
Some demos are born from a very technical requirement. Others are born from a simple idea that everyone immediately understands.
This one started with a familiar concept: a football quiniela.
The objective was to prepare an engaging demo for an event where business users, technical teams, and customers could easily connect with the story. Instead of choosing a generic machine learning use case, the idea was to use something universal, emotional, and easy to discuss: predicting football match outcomes for the 2026 World Cup.
Football is a perfect scenario for this kind of demonstration. It has history, statistics, uncertainty, strong opinions, and a natural prediction problem. Everyone can understand questions such as:
- Who is likely to win this match?
- Which teams are in the best form?
- Could Spain reach the semi-finals?
- Which teams are the strongest candidates based on recent performance?
- Is there a potential surprise in the data?
Behind these simple questions, however, there is a complete data science workflow: data collection, data preparation, feature engineering, model training, model evaluation, scenario prediction, and conversational analytics.
This article explains the complete cycle from beginning to end and shows how Oracle Autonomous Database, Oracle Machine Learning, and the Data Science Agent can support an end-to-end AI and analytics workflow directly where the data lives.
1. The Demo Scenario: A World Cup Prediction Assistant
The demo presents a football match prediction use case focused on the 2026 World Cup.
The main idea is to build an assistant capable of analysing international football data and supporting questions around match predictions, team rankings, tournament scenarios, and knockout paths.
The business narrative is intentionally simple:
What if we could build a modern quiniela powered by data, machine learning, and conversational analytics?
Instead of manually guessing results, the system uses historical match data and team-level performance indicators to estimate likely outcomes.
The demo is not intended to replace sports analysts or claim absolute certainty. Football remains unpredictable. The value of the demo is to show how Oracle technologies can transform raw historical data into an interactive AI-powered experience.
The use case also makes machine learning more accessible. Users do not need to understand every detail of model training to interact with the final result. They can ask natural-language questions such as:
- Predict Spain vs Morocco.
- Rank the top 10 teams based on recent performance.
- Which teams are likely semi-finalists?
- Show me Spain’s possible knockout path.
- Which teams have the strongest attacking profile?
This creates a bridge between technical AI workflows and business-friendly consumption.
2. End-to-End Architecture
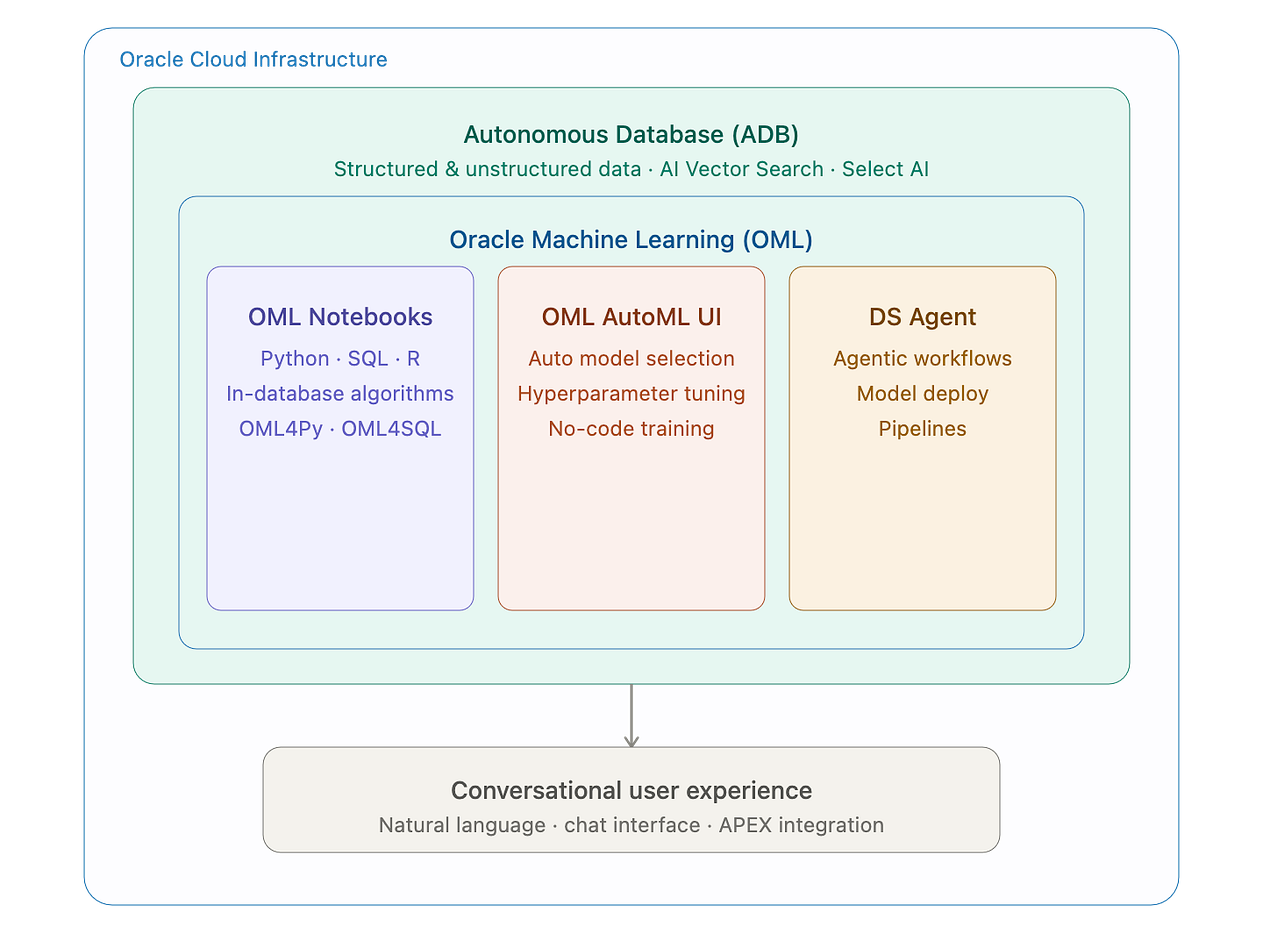
The solution follows a complete AI and analytics lifecycle using Oracle services.
At a high level, the architecture includes:
- Oracle Autonomous Database as the central data platform.
- SQL-based data preparation and feature engineering to transform raw match history into model-ready datasets.
- Oracle Machine Learning to train and compare predictive models.
- Oracle Machine Learning Notebooks / OML UI to explore the data and build the modelling workflow.
- Data Science Agent and conversational analytics to ask questions about the dataset, models, and predictions.
4. Select AI / AI-powered interaction to make the experience accessible through natural language.
For readers who want to explore the official product documentation, Oracle provides dedicated documentation for Machine Learning with Autonomous AI Database, Oracle Machine Learning Notebooks, Select AI for natural-language interaction with Autonomous Database, and the Oracle Cloud Data Science Agent User’s Guide.
The key idea is that the data does not need to be moved across multiple disconnected tools. The preparation, analysis, modelling, and conversational exploration can happen close to the data inside the Oracle ecosystem.
This is especially valuable in enterprise scenarios, where governance, security, performance, and reproducibility matter.
3. Data Foundation: From Match History to Analytical Dataset
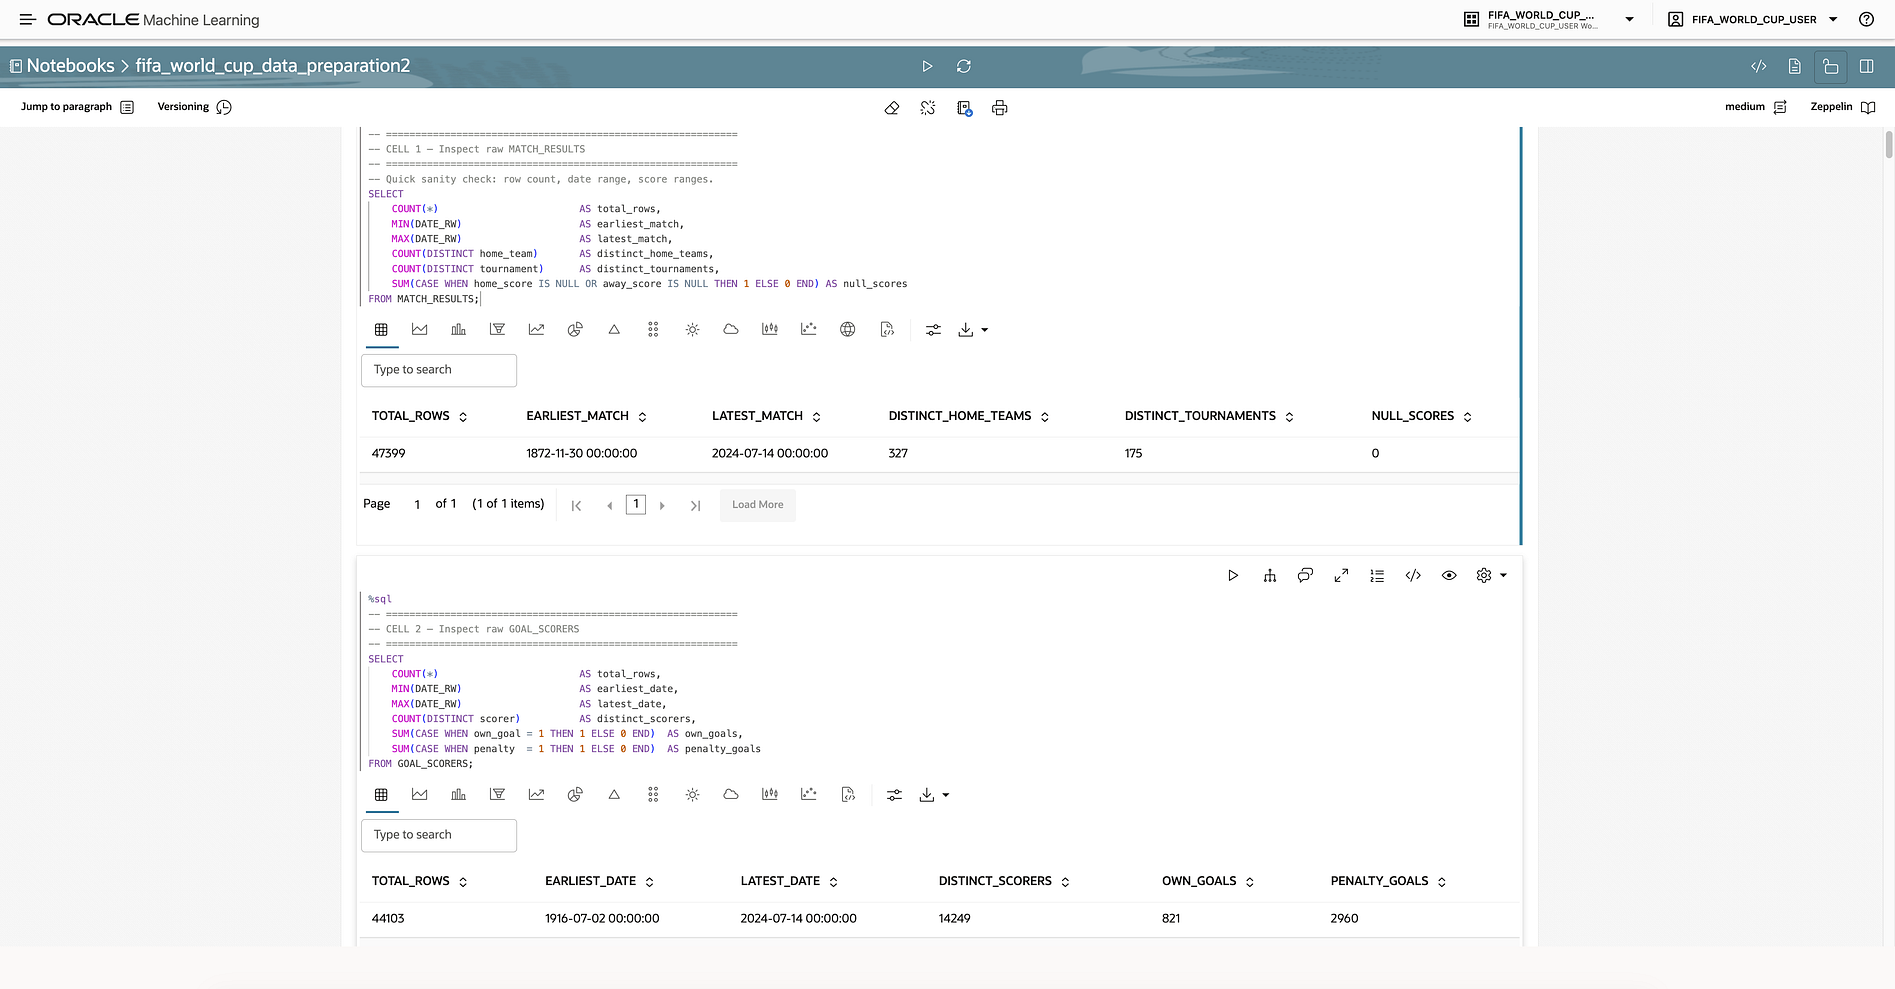
The first step was to consolidate international football match data into Autonomous Database.
The raw data contained historical match-level information such as teams, match dates, scores, and outcomes. However, raw match data is not enough for a good predictive use case. A machine learning model needs structured input variables that represent the context before a match is played.
This is where data preparation becomes critical.
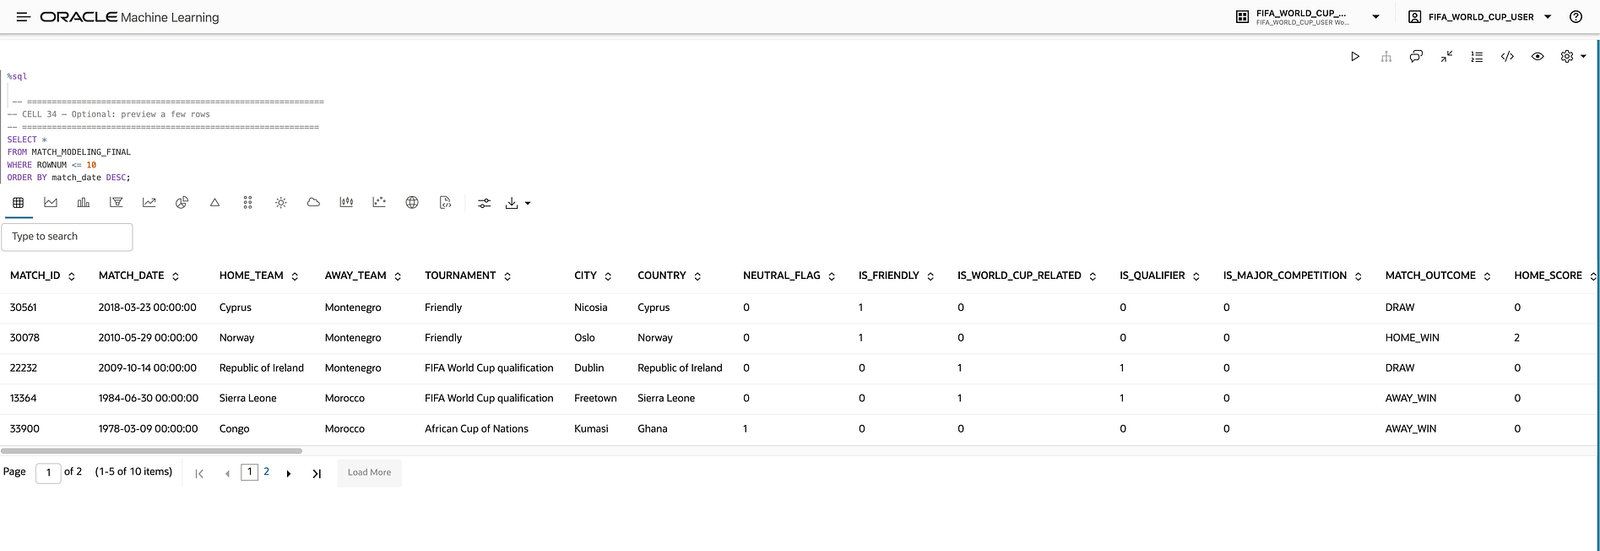
The goal was to transform historical matches into a modelling table where each row represents a match scenario and each column contains useful predictors.
Examples of useful features include:
- Recent win rate.
- Recent form.
- Average goal difference.
- Average goals scored.
- Team-level performance indicators.
- Head-to-head context.
- Home and away team attributes.
The resulting modelling table was designed to support predictions without relying on information that would only be known after the match.
This distinction is fundamental in any predictive modelling project.
4. Avoiding Data Leakage
One of the most important parts of the demo was ensuring that the model did not cheat.
In football data, it is very easy to accidentally include variables that directly reveal the result. For example:
- Home score.
- Away score.
- Final goal difference.
- Match result derived from the final score.
These fields are useful for historical analysis, but they cannot be used as predictors when simulating future matches. If they are included, the model will appear extremely accurate, but the prediction will not be realistic.
This is known as data leakage.
In this demo, score-derived fields such as HOME_SCORE, AWAY_SCORE, and GOAL_DIFF were explicitly excluded from the predictive inputs when running scenario predictions.
The model should only use information that would be available before the match, such as recent form, win rate, attacking strength, and historical context.
This is one of the most valuable lessons of the demo: a machine learning workflow is not only about training a model. It is about designing the right dataset, asking the right questions, and making sure the model learns from valid signals.
5. Feature Engineering Logic
Feature engineering is the process of converting raw data into meaningful variables that a model can use.
For this demo, the focus was on creating features that describe the recent and historical strength of each team.
Recent Win Rate
Recent win rate gives a simple but powerful view of how often a team has been winning in its latest matches.
A team with a high win rate is generally more consistent and may be better positioned in a knockout scenario. However, win rate alone is not enough, because it does not capture the quality of victories, goal margin, or offensive strength.
FORM5
FORM5 represents the most recent short-term form of a team, based on its latest matches.
This is important because football teams evolve over time. A historically strong team may be underperforming recently, while another team may arrive at the tournament with strong momentum.
Short-term form helps the model reflect the current competitive state of the team.
Average Goal Difference
Average goal difference is a useful proxy for dominance.
A team that consistently wins by more goals may have stronger control over matches than a team that wins narrowly. This feature helps differentiate teams with similar win rates but different performance profiles.
Average Goals Scored
Average goals scored captures attacking potential.
For example, two teams may both have strong recent results, but one may achieve them through high-scoring attacking football, while another may rely more on defensive stability. Including average goals scored helps represent this difference.
Head-to-Head Context
Head-to-head information can be useful as supporting context, especially for explaining predictions in a way that users understand.
However, in the demo, head-to-head was treated carefully. It should support interpretation but not dominate the prediction, because historical matchups may be sparse, outdated, or influenced by conditions that no longer apply.
6. Preparing the Modelling Table in Autonomous Database
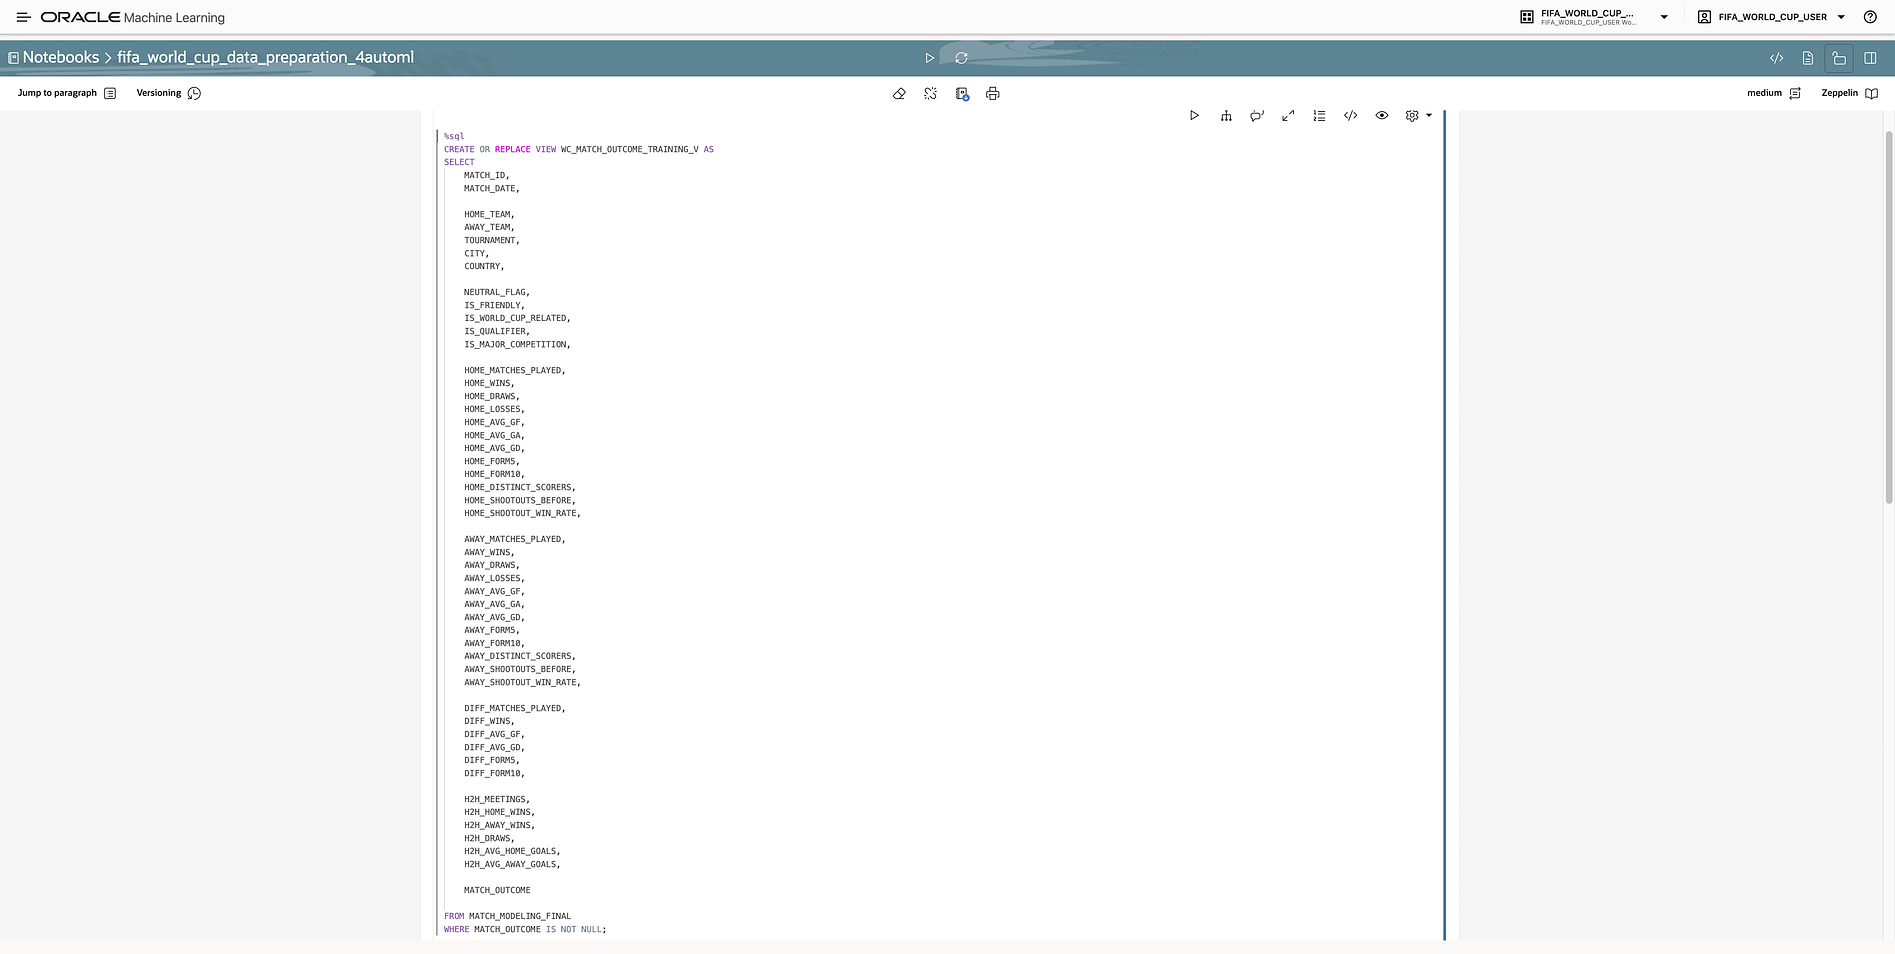
Once the relevant variables were defined, the next step was to prepare the final modelling table in Autonomous Database.
The table used for the modelling workflow was MATCH_MODELING_FINAL.
This table consolidated the engineered features and the target variable required for training. It was designed to be consumed by Oracle Machine Learning and by conversational components later in the demo.
The preparation process included several typical data science steps:
- Cleaning and standardising match records.
- Ensuring team names and identifiers were consistent.
- Creating aggregated team-level indicators.
- Calculating recent performance metrics.
- Separating historical outcome fields from valid predictive fields.
- Preparing a model-ready structure for OML.
Using Autonomous Database for this step brings an important advantage: SQL is extremely powerful for feature engineering, aggregations, joins, and analytical transformations.
Many machine learning demos start by exporting data to external tools. In this case, the data preparation could remain inside the database, making the workflow more governed, scalable, and reproducible.
7. Training Predictive Models with Oracle Machine Learning
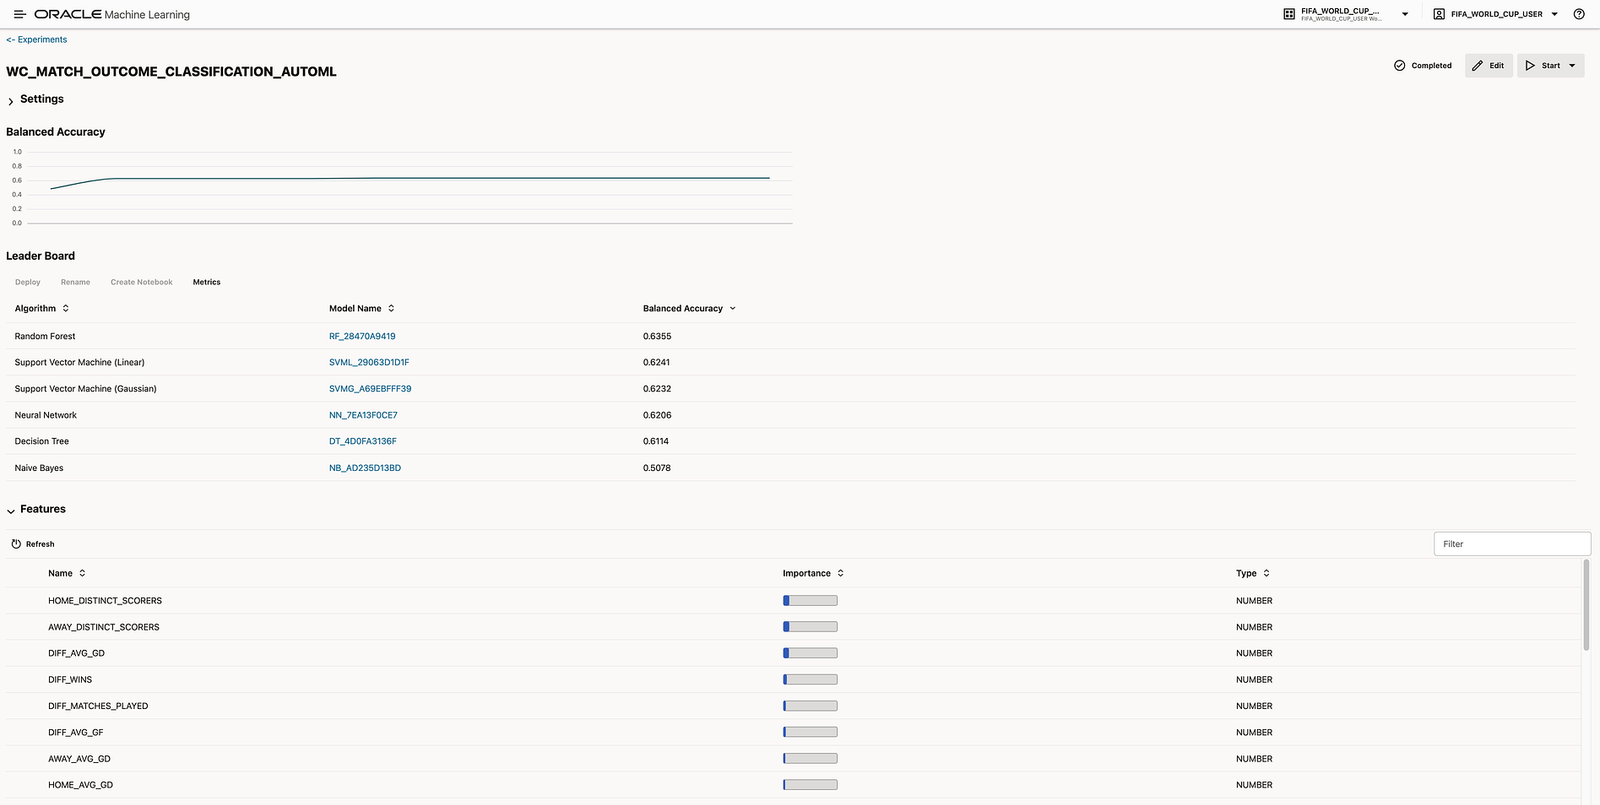
After preparing the modelling table, the next step was to train machine learning models using Oracle Machine Learning.
Oracle Machine Learning allows data scientists and analysts to build models using data directly inside the database. This reduces data movement and enables the model development lifecycle to happen closer to enterprise data. Oracle’s documentation describes OML as a way to accelerate data exploration, preparation, model building, evaluation, and deployment using scalable and secure machine learning capabilities: Oracle Machine Learning documentation.
For this demo, OML was used to train classification models capable of predicting the outcome of a football match.
The target variable represents the match result category. Depending on the modelling design, this can be framed as:
- Home team win.
- Away team win.
- Draw.
Or, for some scenario-based questions, it can be simplified into predicting the likely winner between two teams.
The value of OML in this context is not only the algorithm itself. It is the complete workflow:
- Data exploration.
- Model training.
- Algorithm comparison.
- Evaluation.
- Model interpretation.
- Prediction generation.
OML supports multiple machine learning algorithms and allows the user to compare model performance. This is especially useful in a demo because it shows that machine learning is an iterative process.
For the automated modelling part, the demo can also be connected to Oracle’s AutoML capabilities. The official documentation explains that the AutoML UI supports automated algorithm selection, feature selection, and model tuning, which is especially useful when quickly comparing modelling approaches or creating a strong baseline.
One of the most valuable aspects of this workflow is that, after running the AutoML experiment, Oracle Machine Learning can automatically generate a notebook with the code behind the selected model. This is important because the process does not end with an automated result or a black-box recommendation. The generated notebook gives the data scientist a complete starting point to continue working with the model.
From that generated notebook, the data scientist can:
- review the selected algorithm and model settings;
- inspect the training data used by the experiment;
- retrain the model with the same configuration;
- modify the list of input features;
- adjust model hyperparameters;
- try alternative algorithms;
- change the evaluation logic;
- add custom validation steps;
- adapt the code for production or future retraining.
This is a powerful combination: AutoML accelerates the initial experimentation phase, while the generated notebook gives full control back to the technical user. In other words, OML AutoML helps create a strong baseline quickly, but it still supports the deeper, iterative workflow expected by data scientists.
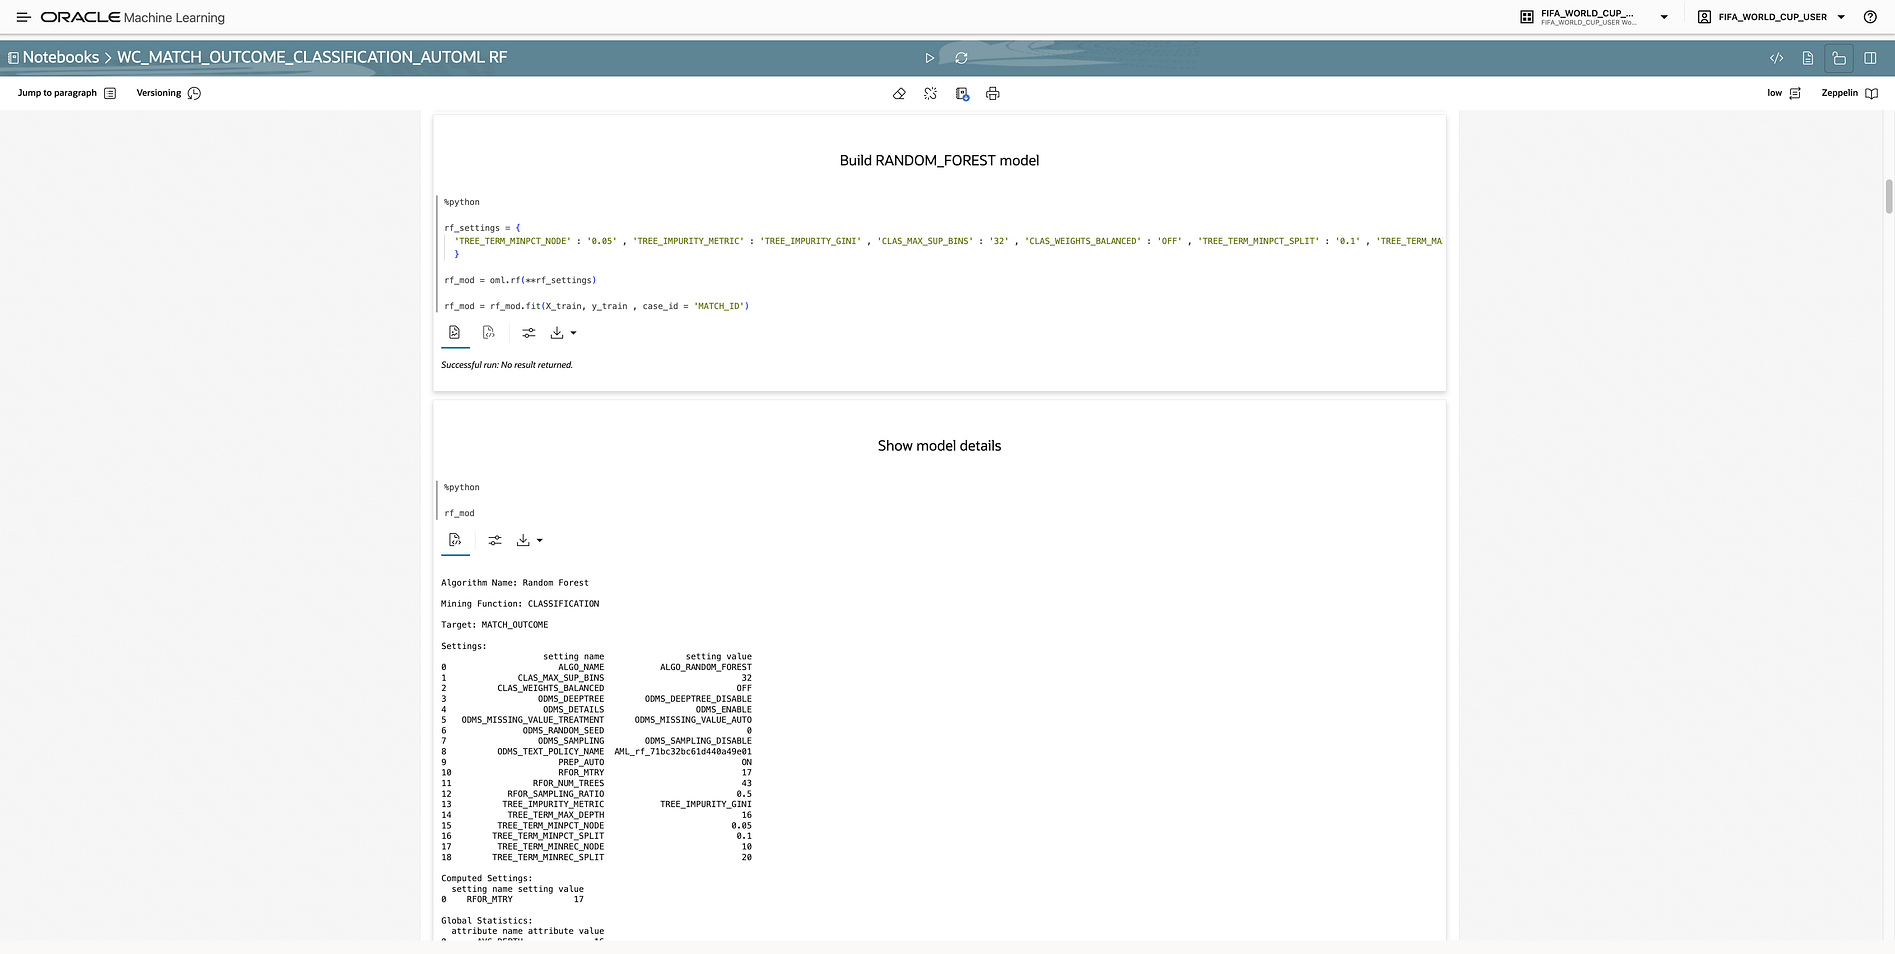
You do not simply train one model and assume it is the best. You compare alternatives, evaluate metrics, validate assumptions, refine the feature set, and then use the generated notebook as a reproducible foundation for improvement.
8. Why OML Adds Value in This Demo
The demo puts Oracle Machine Learning in a very practical context.
Instead of presenting OML as an abstract platform, the use case shows how it helps answer a real prediction question.
OML adds value in several ways.
First, it keeps the data and modelling workflow inside Autonomous Database. This is important because enterprise data often already lives in Oracle Database, and moving it unnecessarily can introduce complexity, governance issues, and latency. This aligns with the official Oracle Machine Learning positioning for Autonomous AI Database, where machine learning capabilities are available directly with the database platform: Machine Learning with Autonomous AI Database.
Second, it supports a data scientist workflow. The user can prepare data, train models, evaluate performance, and generate predictions in a controlled environment.
Third, it makes model development more accessible. OML provides capabilities that can support both technical users and less specialised users through automated or guided workflows.
Finally, it connects naturally with the broader Oracle AI ecosystem, including conversational analytics and AI agents.
In this demo, OML is not an isolated component. It is the modelling engine inside a broader analytical experience.
9. Scenario Predictions: Turning Model Outputs into a Story
Once the model and performance indicators were available, the next step was to make the predictions understandable.
For example, the demo can analyse a possible Spain knockout path:
- Spain vs Morocco.
- Spain vs Germany.
- Spain vs France.
- Spain vs Argentina.
For each match, the assistant can compare both teams using the selected signals:
- Recent win rate.
- FORM5.
- Average goal difference.
- Average goals scored.
- Head-to-head context as supporting information.
The important point is that the prediction is not presented as a black box. The assistant explains the reasoning behind each result.
For example:
- Spain may be favoured against Morocco because of stronger recent form, higher average goal difference, and stronger attacking metrics.
- A match against Germany may be more balanced because Germany can show strong goal difference and form, even if its recent win rate is weaker.
- A match against Argentina may be highly competitive because Argentina combines an excellent win rate with strong attacking output.
This makes the demo more engaging. Users are not only receiving a predicted winner. They are also understanding why the model or analytical logic favours one team over another.
That explainability layer is critical for customer-facing AI demos.
10. Bringing in the Data Science Agent
The next layer of the demo is the Data Science Agent.
The Data Science Agent allows users to interact with data science workflows in a conversational way. Instead of manually writing every query or navigating every table, users can ask questions about the dataset, the features, the model, or the results.
For readers interested in the official product details, Oracle provides a dedicated Data Science Agent User’s Guide. Oracle also describes the Data Science Agent as a conversational assistant for analytics and machine learning in Autonomous AI Database in this official Oracle Machine Learning blog post: Data Science Agent: Native Conversational Analytics and Machine Learning in Autonomous AI Database.
In this demo, the Data Science Agent was not used only as a final chatbot interface. It was used as part of the analytical workflow, after the preparation notebooks and before the final prediction experience.
This is an important distinction.
Before asking the assistant to predict Spain’s knockout path or identify likely semi-finalists, there was already a significant amount of analysis behind the scenes. The notebooks prepared the dataset, engineered the features, validated the modelling table, and explored the behaviour of the variables. The Data Science Agent then helped make that analysis interactive.
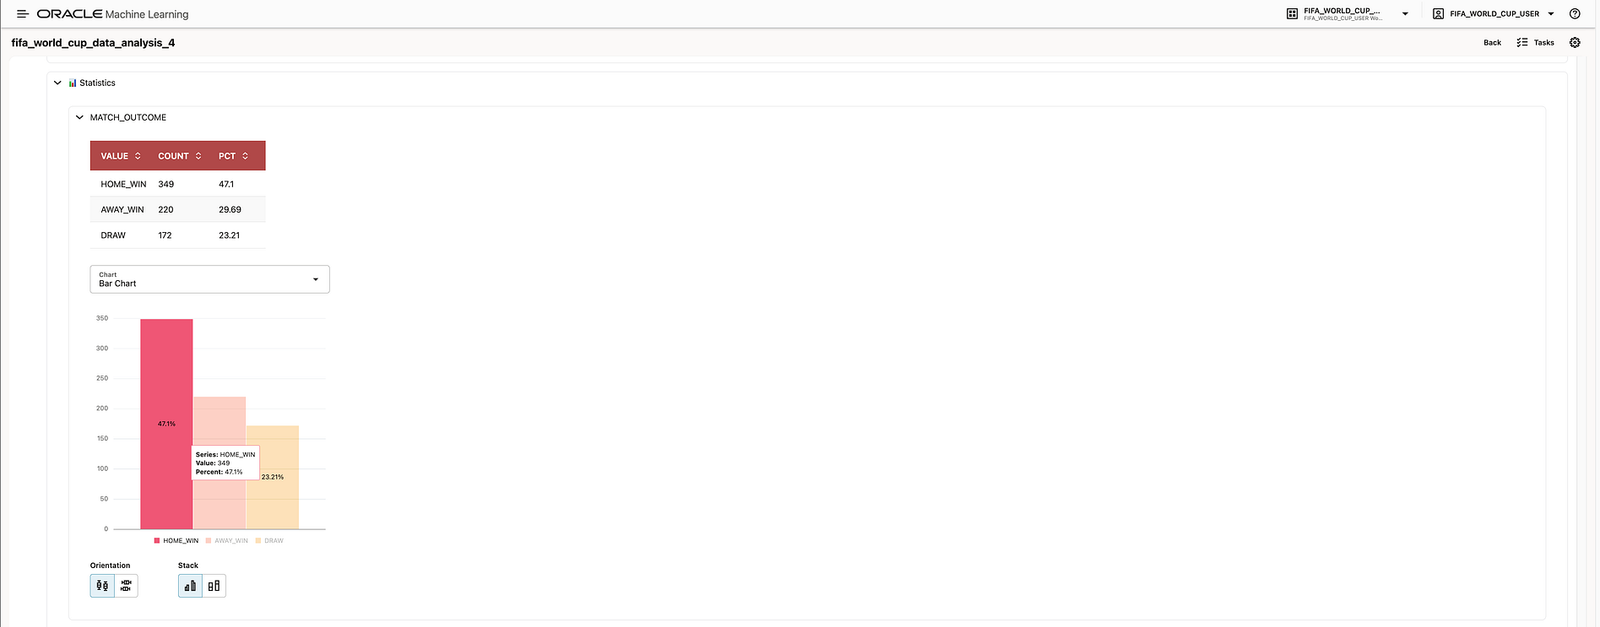
The first type of question was focused on validating and understanding the final modelling table:
How many matches are in
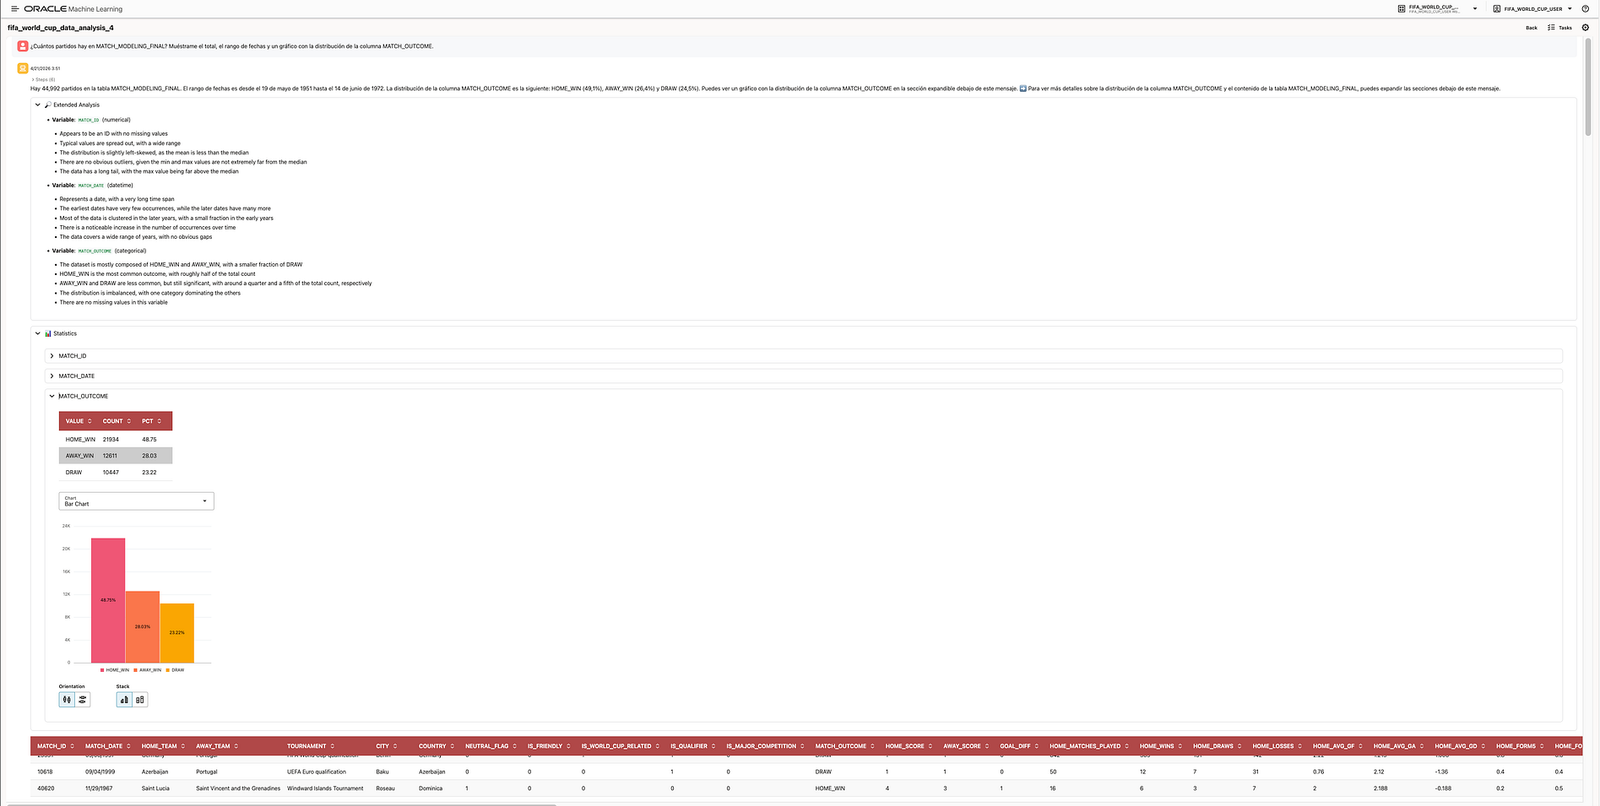
MATCH_MODELING_FINAL? Show me the total, the date range, and a chart with the distribution ofMATCH_OUTCOME.
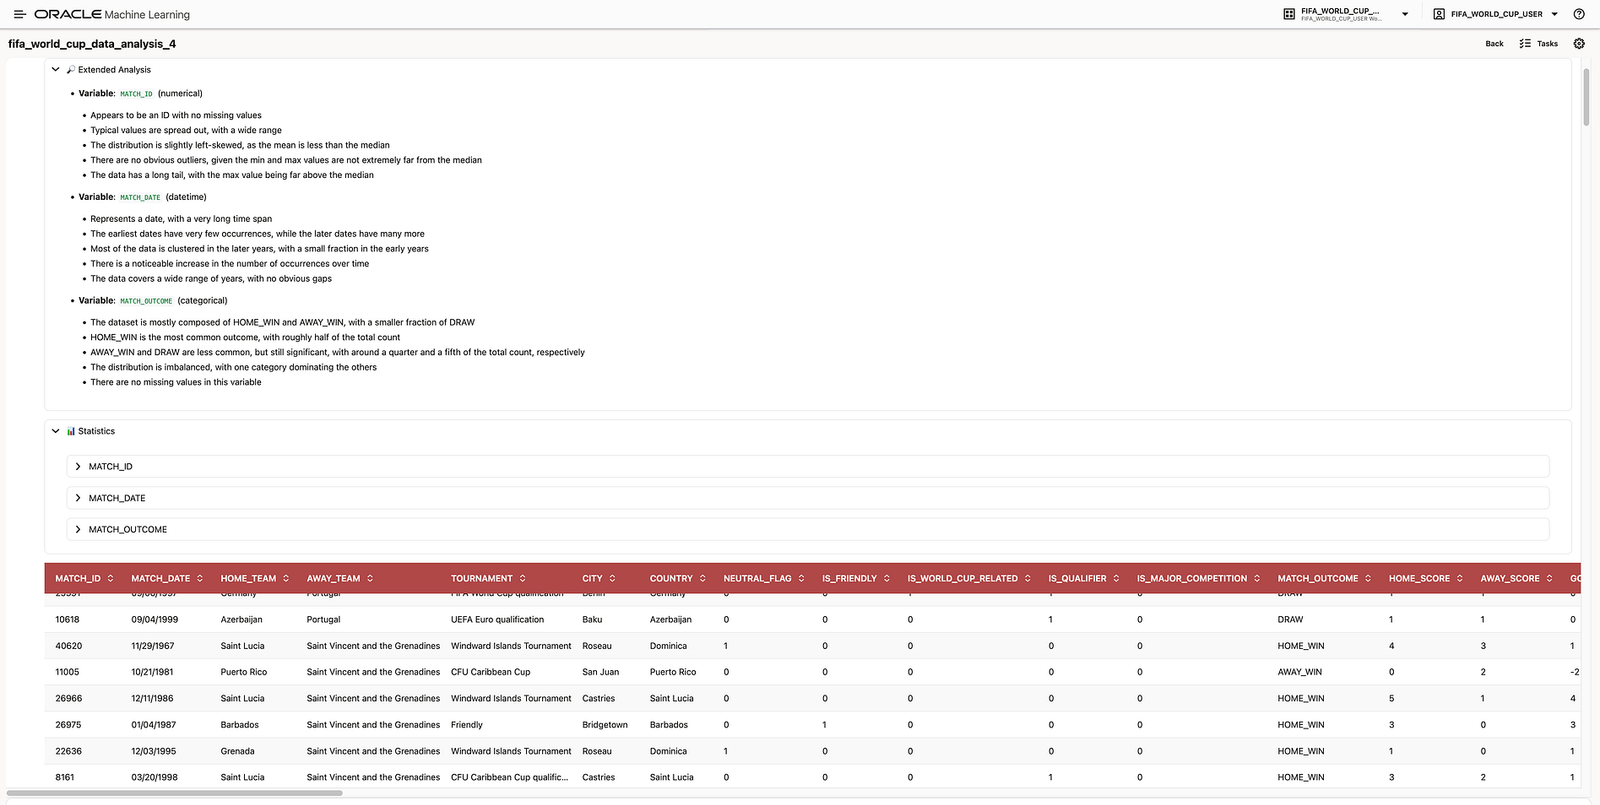
The agent returned a high-level summary of the table, including the total number of matches, the available date range, and the outcome distribution. In the demo, this showed that the dataset contained 44,992 matches and that the target variable was distributed across HOME_WIN, AWAY_WIN, and DRAW.
This type of question is useful because it validates the foundation of the modelling workflow. Before training or trusting a predictive model, we need to understand the target distribution, the available history, and the shape of the data.
The agent also generated an extended analysis of relevant variables such as:
MATCH_ID, validating it behaves like an identifier;MATCH_DATE, showing the long historical span and the concentration of records in more recent years;MATCH_OUTCOME, showing that home wins are the most common outcome and that the target is somewhat imbalanced.
This matters because class imbalance affects how we interpret model quality. If one class dominates the target, plain accuracy can be misleading, and metrics such as balanced accuracy become more relevant.
10.1 Using the Agent for Exploratory Analysis
After validating the table, the next step was to ask more analytical questions.
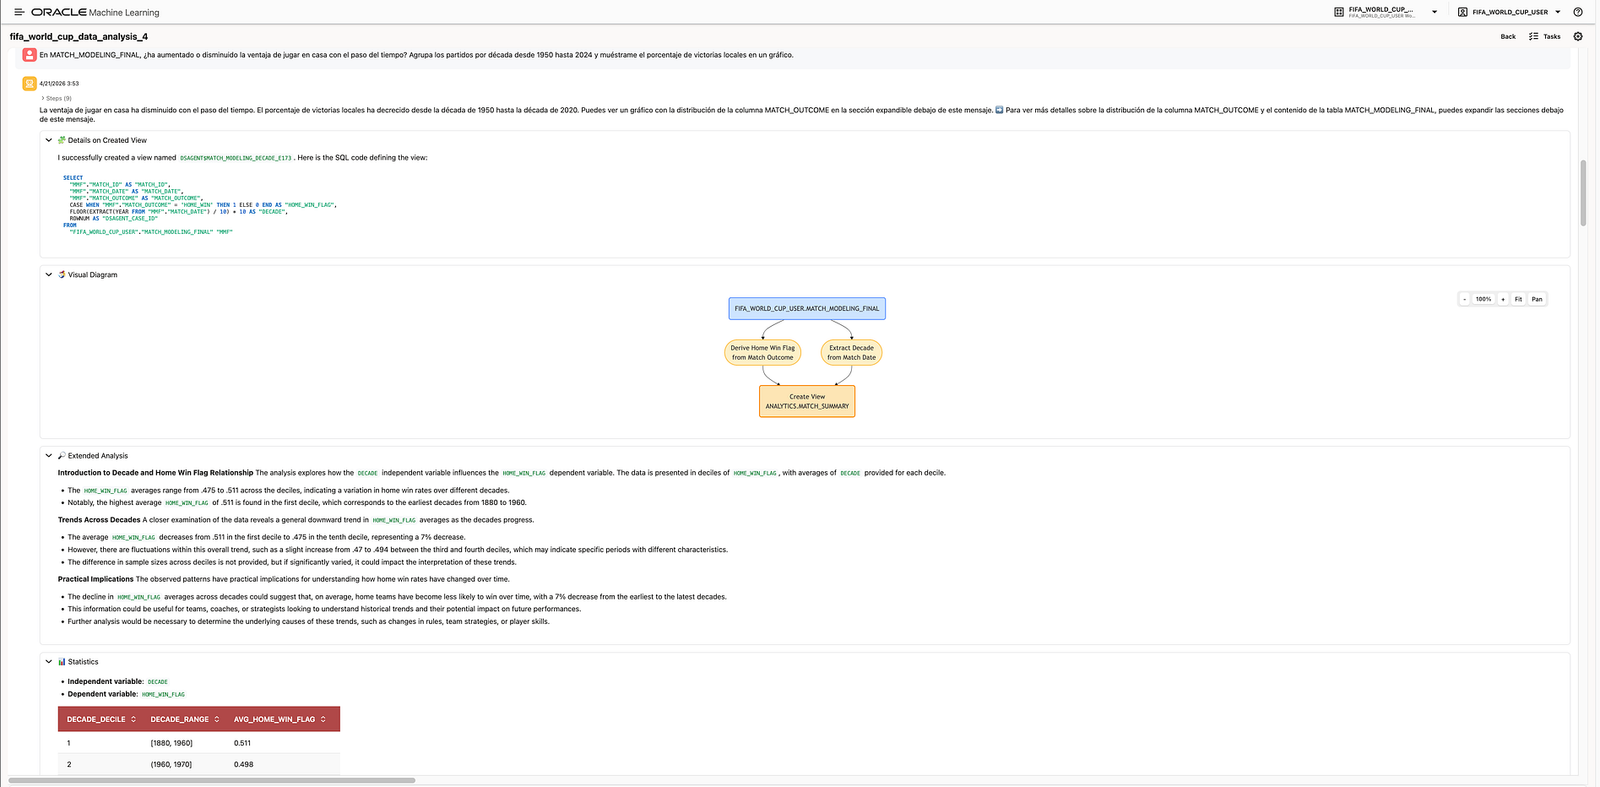
For example, one question explored whether home advantage has changed over time:
In
MATCH_MODELING_FINAL, has the advantage of playing at home increased or decreased over time? Group matches by decade from 1950 to 2024 and show the percentage of home wins in a chart.
The agent created a derived view with a HOME_WIN_FLAG and a DECADE column. This is one of the most interesting aspects of the Data Science Agent: it can create analytical objects to support the question, not just return a static answer.
In the demo, the agent identified a downward trend in home win rate across decades. The analysis suggested that the average home win rate decreased from the earliest periods to more recent decades.
This is exactly the kind of insight that makes the demo stronger. The agent is not only answering “what is in the table?” It is helping explore historical behaviour and generate hypotheses.
Another question tested whether recent form is actually related to match outcome:
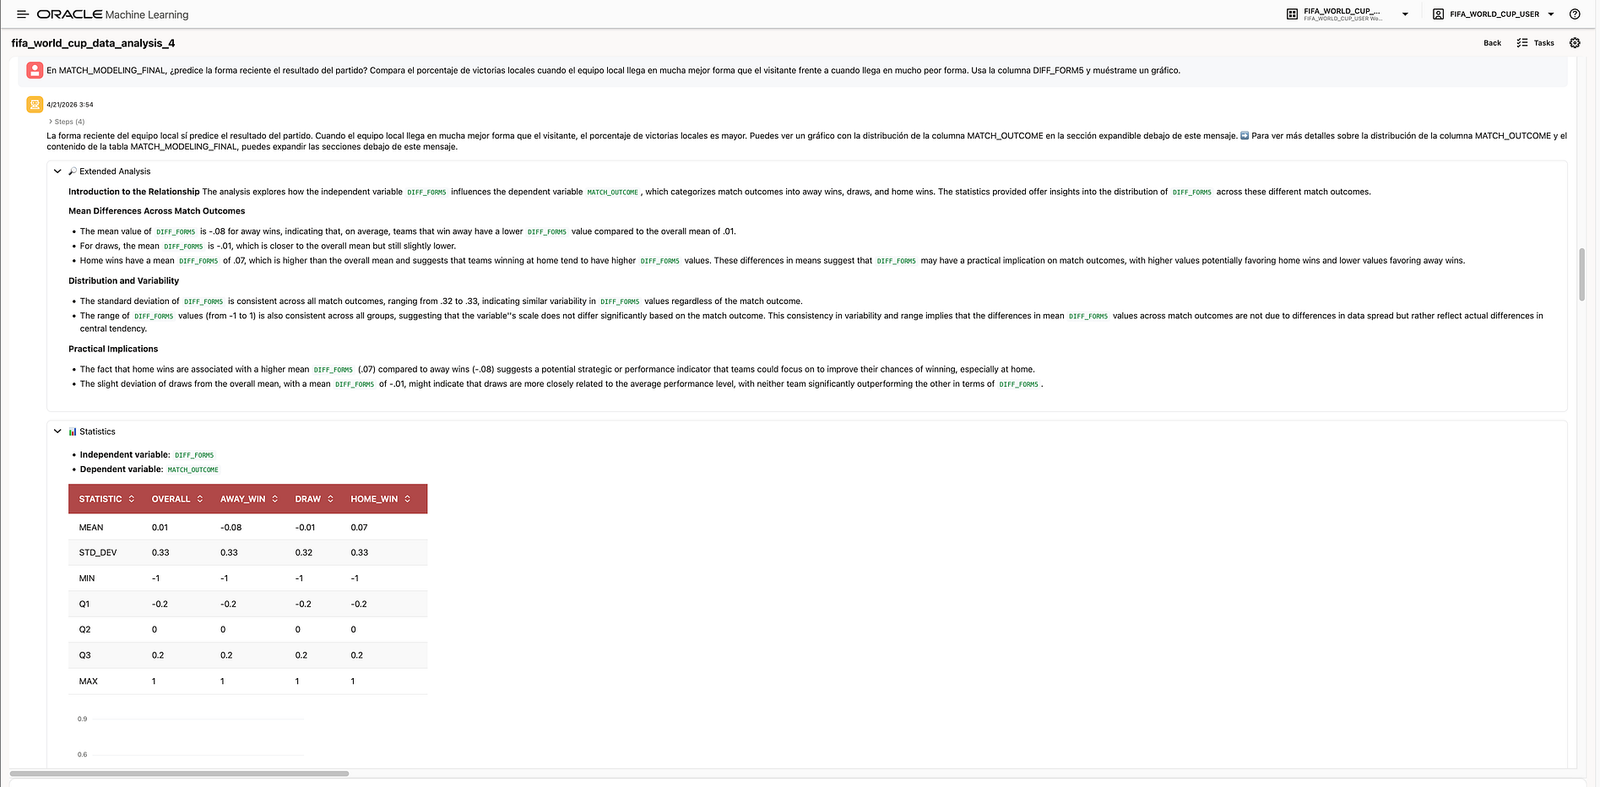
In
MATCH_MODELING_FINAL, does recent form predict the match result? Compare the percentage of home wins when the home team arrives in much better form than the away team versus when it arrives in much worse form. UseDIFF_FORM5and show me a chart.
The agent analysed the relationship between DIFF_FORM5 and MATCH_OUTCOME. The result was directionally meaningful: home wins were associated with a higher average DIFF_FORM5, while away wins were associated with a lower average DIFF_FORM5.
This is valuable because DIFF_FORM5 is one of the core engineered features used in the demo. The agent helped validate that this feature captures a relevant football signal.
10.2 Using the Agent to Understand Predictive Signals
The agent was also used to compare the predictive power of different engineered features.
One example question was:
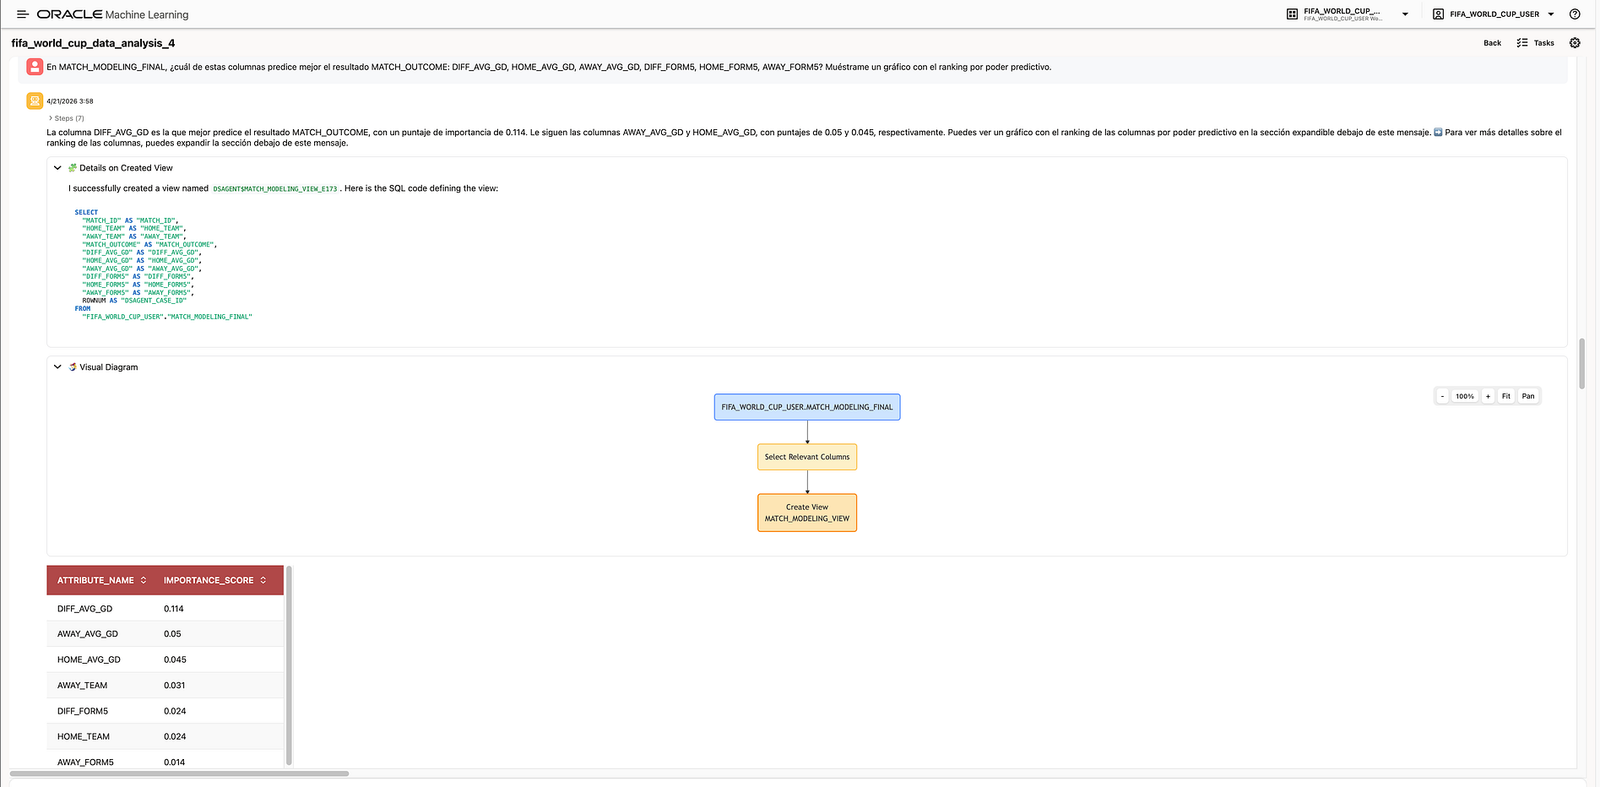
In
MATCH_MODELING_FINAL, which of these columns best predictsMATCH_OUTCOME:DIFF_AVG_GD,HOME_AVG_GD,AWAY_AVG_GD,DIFF_FORM5,HOME_FORM5,AWAY_FORM5? Show me a chart ranking them by predictive power.
The agent ranked the variables and identified DIFF_AVG_GD as the strongest predictor among the selected features, followed by goal-difference-related variables such as AWAY_AVG_GD and HOME_AVG_GD.
This result is easy to explain in football terms. Goal difference is often a strong indicator of overall team strength because it captures both attacking and defensive performance. A team that consistently scores more than it concedes is usually more robust than a team with isolated wins but weaker aggregate performance.
This kind of analysis helps connect the machine learning workflow with domain intuition. It gives the audience a reason to trust the features being used.
10.3 Spain-Focused Exploration
Because the demo was designed for an event audience, Spain was used as a concrete storytelling example.
The agent was asked questions such as:
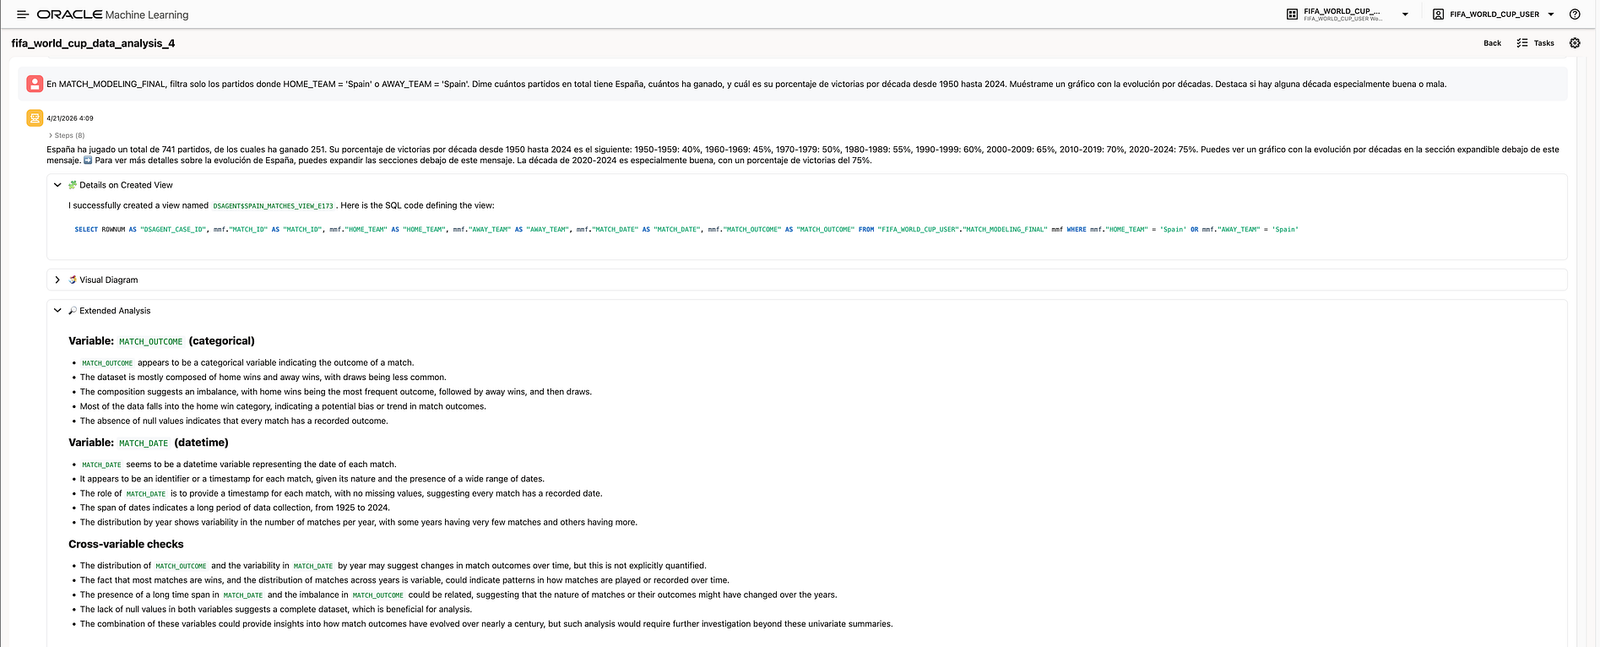
Filter only matches where
HOME_TEAM = 'Spain'orAWAY_TEAM = 'Spain'. Tell me how many matches Spain has played, how many it has won, and its win percentage by decade from 1950 to 2024. Show me a chart with the evolution by decade and highlight any especially good or bad decade.
The agent created a Spain-specific view over MATCH_MODELING_FINAL, filtering matches where Spain appeared either as home team or away team.
This made the analysis more relatable. Instead of showing only global football statistics, the demo could zoom into a national team and build a narrative around its historical evolution, recent performance, and possible World Cup path.
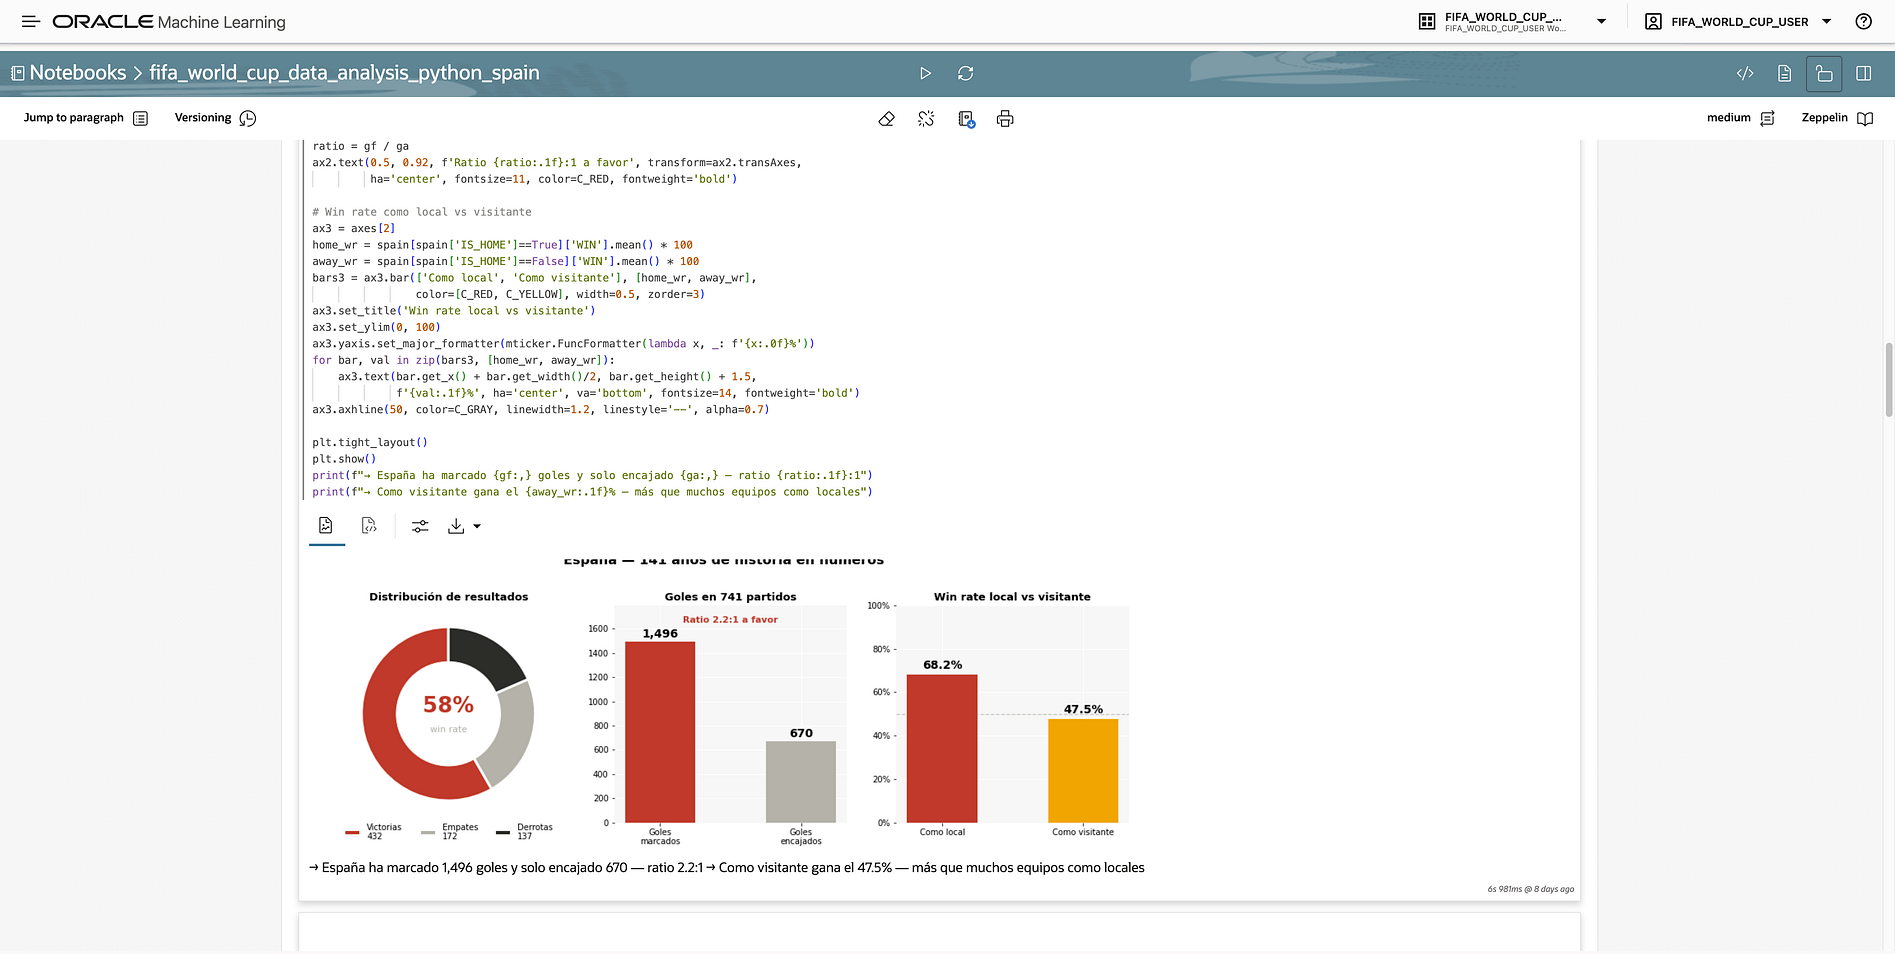
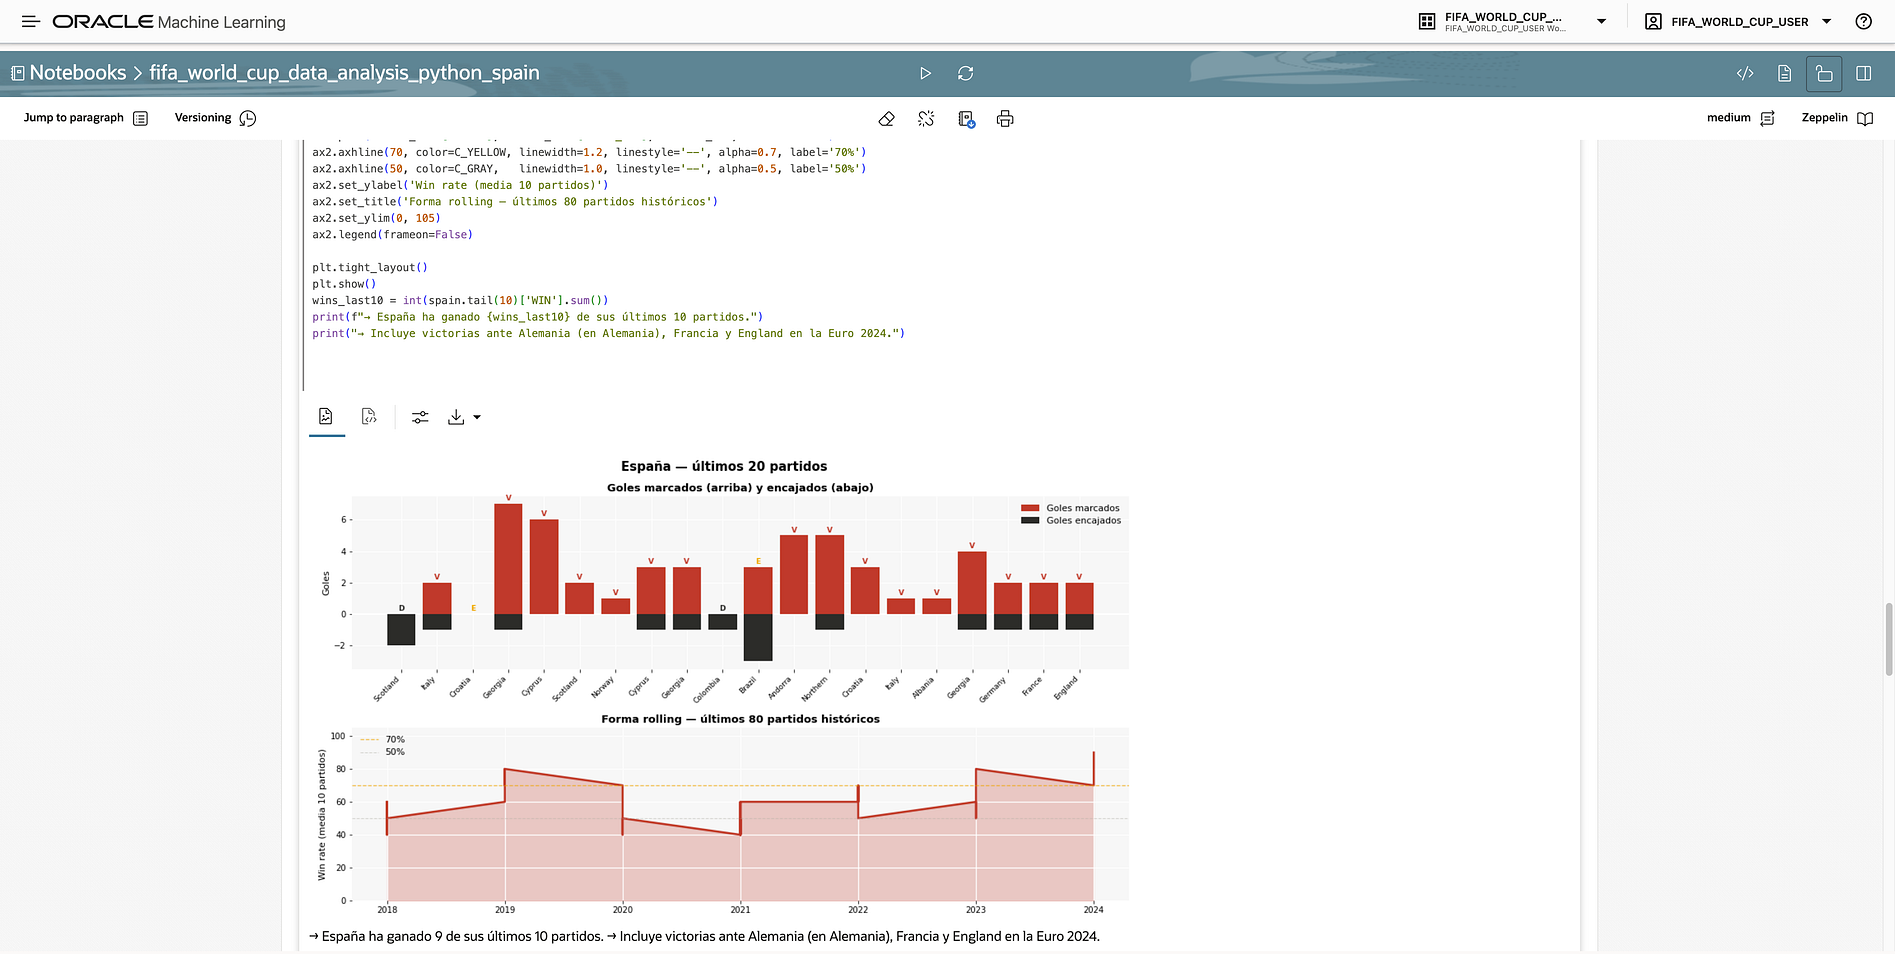
In the broader notebook analysis, Spain was also explored separately through a dedicated notebook. That prior analysis gave additional context around Spain’s historical performance, recent form, goals scored and conceded, and head-to-head records against major opponents.
10.4 From Open Exploration to Controlled Prediction Prompts
Once the exploratory analysis was complete, the final demo moved into a more controlled prediction experience.
This is where the prompts became intentionally detailed.
For example, the assistant was asked to predict Spain’s 2026 World Cup knockout run using only selected signals:
- recent win rate;
FORM5;AVG_GD;AVG_GF;- head-to-head as supporting context only.
The prompt also explicitly instructed the assistant not to use HOME_SCORE, AWAY_SCORE, or GOAL_DIFF as predictors.
This level of detail is deliberate. In a live demo, especially one involving predictions, it is important to control the reasoning path and avoid accidental leakage. The assistant should not infer from final scores or use variables that would not be available before a future match.
The same approach was used for other demo questions, such as:
- ranking top goal-scoring teams;
- identifying likely semi-finalists;
- predicting a Spain vs Argentina final;
- highlighting one surprising insight from the data.
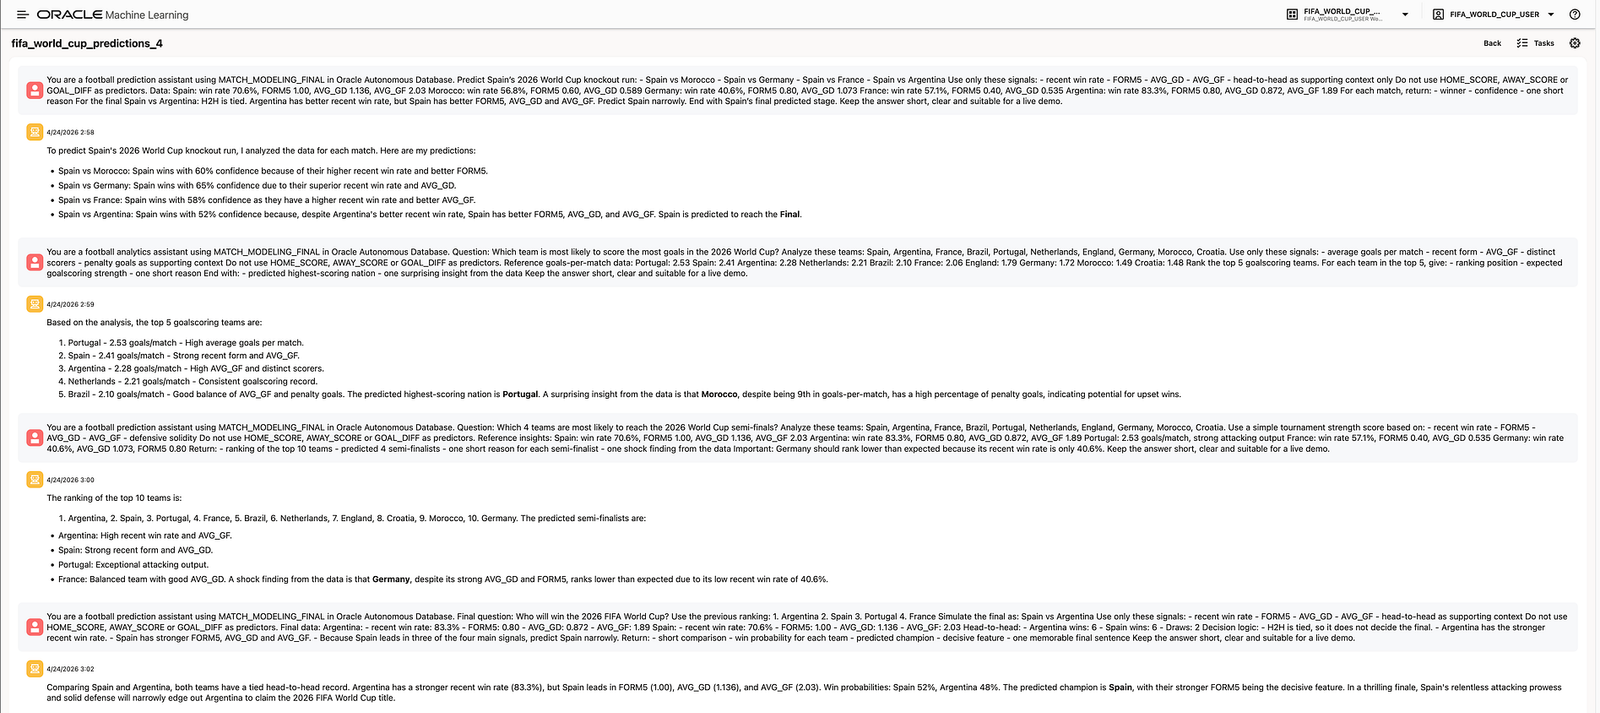
In this part of the demo, the assistant was not simply asked a vague question like “Who will win the World Cup?”. Instead, the prompt provided the relevant feature values and constraints. This makes the answer more reliable, more explainable, and easier to present live.
For example, in the Spain knockout-path scenario, the assistant compared Spain against Morocco, Germany, France, and Argentina using the selected signals. It returned a short, demo-friendly prediction for each match, including the likely winner, confidence, and one concise explanation.
This is useful for an event because the audience can immediately understand both the result and the reasoning behind it.
10.5 Why the Demo Provides So Much Context to the Agent
A key design decision in this demo was to give the agent and assistant a lot of structured context.
This was done for several reasons.
First, the dataset contains both valid predictive features and leakage-prone historical fields. By explicitly stating which variables can and cannot be used, the demo enforces the same modelling discipline used during the notebook preparation.
Second, football predictions are easy to overgeneralise. Without context, an assistant might rely on generic football knowledge instead of the prepared dataset. By providing specific feature values from MATCH_MODELING_FINAL, the response remains grounded in the data used for the demo.
Third, the demo needed to be suitable for a live audience. Detailed prompts help produce concise, stable, explainable answers that can be shown during an event without requiring long technical interpretation.
Finally, this mirrors a real enterprise pattern. In business AI use cases, a good assistant should not answer only from general knowledge. It should be grounded in curated data, validated features, governance rules, and domain-specific constraints.
That is the real point of the Data Science Agent and conversational layer in this demo: not just to chat with data, but to make a prepared analytical and machine learning workflow accessible through natural language.
This conversational flow is much closer to how business users think. A user may start with a broad data-quality question, continue with exploratory analysis, ask which features matter most, zoom into a specific entity such as Spain, and finally run controlled prediction scenarios based on trusted signals.
11. Select AI and Natural-Language Consumption
Another important part of the story is the ability to consume data using natural language.
With Select AI or an AI-powered assistant experience, users can ask business questions without needing to know the underlying SQL structure. Oracle’s official documentation explains that Select AI enables natural-language interaction with Autonomous Database and that AI profiles can be managed through the DBMS_CLOUD_AI package: Use Select AI for Natural Language Interaction with your Autonomous Database.
This is particularly useful for executive and event audiences.
For example, instead of writing SQL, a user can ask:
Who are the top 5 goal-scoring teams?
Or:
Rank the top 10 teams based on recent performance and attacking strength.
Or:
Predict Spain’s route in the knockout stage.
The assistant can then translate the question into analysis over the available data and return a business-friendly answer. For technical readers, the official DBMS_CLOUD_AI package documentation provides more detail on how Select AI supports generating, running, and explaining SQL from natural-language prompts.
This is where the demo becomes especially powerful: the same data foundation can serve both technical and non-technical users.
A data scientist can work with the modelling table and OML. A business user can ask natural-language questions. An executive can explore tournament scenarios during a live session.
This combination is what makes the solution compelling.
12. Demo Flow for an Event
The demo was designed to work well in an event environment.
The flow can be presented as a story:
Step 1: Start with the quiniela idea
Introduce the familiar concept of predicting match outcomes. This immediately creates engagement because everyone understands the scenario.
Step 2: Show the data foundation
Explain that the predictions are based on historical international match data and team-level performance indicators stored in Autonomous Database.
Step 3: Explain the preparation logic
Show how raw data becomes a model-ready dataset. Emphasise the importance of recent form, win rate, goal difference, and attacking strength.
Step 4: Highlight leakage prevention
Explain that final scores are excluded from predictive inputs. This is a key data science concept and shows that the demo is methodologically sound.
Step 5: Train and compare models with OML
Show how Oracle Machine Learning supports the training and evaluation process directly on the database data.
Step 6: Generate predictions
Use example matches such as Spain vs Morocco, Spain vs Germany, Spain vs France, or Spain vs Argentina.
Step 7: Ask questions through the agent
Use the Data Science Agent or conversational analytics layer to ask natural-language questions about the dataset, predictions, and rankings.
Step 8: Close with the enterprise value
Explain that the same pattern applies beyond football: customer churn, demand forecasting, fraud detection, risk scoring, anomaly detection, lead scoring, inventory optimisation, and many other enterprise use cases.
13. Why This Use Case Works Well as a Reusable Asset
Although the topic is football, the architecture is reusable.
The same pattern can be applied to many business domains:
- Historical events become the analytical foundation.
- SQL prepares and enriches the data.
- OML trains predictive models.
- Model outputs are evaluated and explained.
- Conversational AI makes the results accessible.
This makes the demo a strong reusable asset because it is both engaging and transferable.
The football story creates attention, but the underlying message is much broader:
Oracle can support the full AI lifecycle, from data preparation to model training to conversational consumption, using governed enterprise data.
This is the real value of the demo.
Notebook Assets Used in the Demo
The demo was supported by several Oracle Machine Learning notebooks, each covering a different part of the lifecycle:
fifa_world_cup_data_preparation2.dsnb: initial data inspection, cleaning, match master creation, derived fields, indexes, and preparation of the analytical foundation.fifa_world_cup_data_preparation_4automl.dsnb: creation of the final AutoML-ready views, including the clean training view and the modelling view.fifa_world_cup_data_analysis_python.dsnb: exploratory data analysis across the complete international match dataset, including target distribution, outcome evolution, win rates, goal patterns, recent form, and historical volume.fifa_world_cup_data_analysis_python_spain.dsnb: Spain-focused analysis, including historical performance, recent form, decade evolution, head-to-head context, and major competition behaviour.WC_MATCH_OUTCOME_CLASSIFICATION_AUTOML RF.dsnb: AutoML-generated notebook for match outcome classification using Random Forest, including training data preparation, model settings, scoring, and quality metrics.
These notebooks make the demo easier to explain because they show the full journey: from raw data to analytical exploration, from feature preparation to model training, and from model outputs to an interactive prediction story.
Let’s connect!!
LetIf you found this article useful, feel free to connect with me on LinkedIn, follow my articles on Medium, or visit my personal website for more content around Oracle AI, Oracle Machine Learning, Autonomous Database, Data Science, and applied AI demos.
I am always happy to exchange ideas, discuss use cases, or connect with people working on similar projects. You can also write to me directly if you would like to discuss 🙂
Official Documentation References
- Oracle Machine Learning documentation
- Machine Learning with Autonomous AI Database
- Oracle Machine Learning Notebooks
- Oracle Machine Learning AutoML UI
- Use Select AI for Natural Language Interaction with Autonomous Database
DBMS_CLOUD_AIPackage- Oracle Cloud Data Science Agent User’s Guide
- Oracle Machine Learning Blog: Data Science Agent