Introduction
In today’s digital age, museums are increasingly embracing technology to manage and analyze their vast collections. I recently had the opportunity to collaborate with a museum that houses a wealth of historical artifacts captured in digital images. The challenge was to extract meaningful information from these images to assist curators in identifying patterns and similarities across various artifacts, specifically focusing on intricate details like medallions and face-masks.
This project was developed entirely within the Oracle Cloud Infrastructure (OCI) Data Science service, leveraging its powerful machine learning capabilities. The next step is to integrate this solution with Oracle APEX, enabling a seamless graphical interface that allows users to upload images, process them, and visualize the clustering results easily.
The Use Case: Extracting Insights from Historical Artifacts
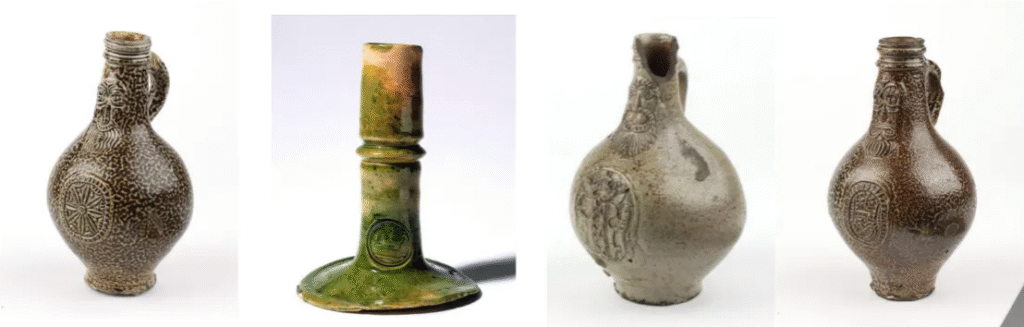
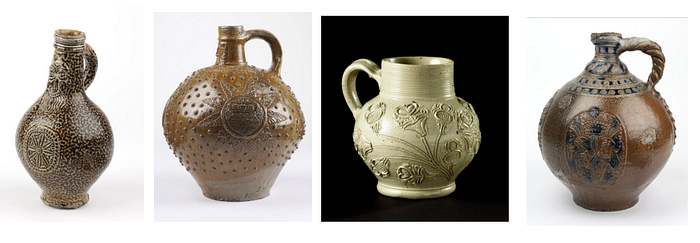
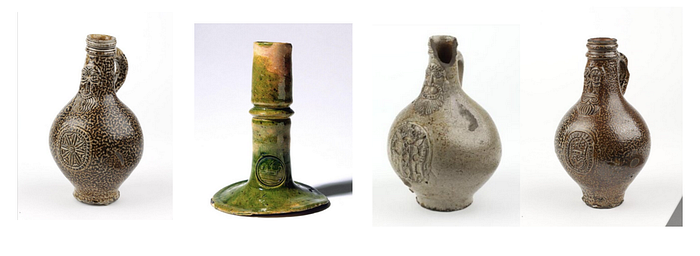
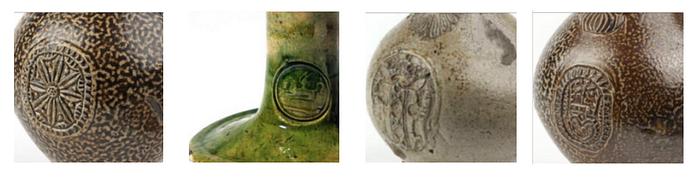
The museum’s collection consists of images of historical artifacts, each with unique designs and features. The curators were particularly interested in analyzing the medallions and face-masks on these artifacts, as these elements often contain intricate details that can reveal important historical information.
To achieve this, I developed a series of scripts within OCI’s Data Science service that automatically process the images, identify and crop the regions containing medallions and face-masks, and then use machine learning algorithms to cluster these images based on visual similarities. This approach allows the museum staff to quickly identify patterns and commonalities across their collection, aiding in research and curation.
Prerequisites and Setup
To run this project, you’ll need:
- A Python environment with the necessary libraries installed (
tensorflow,opencv-python-headless,scikit-learn,matplotlib,joblib). - A collection of images stored in a directory that you want to analyze.
- Basic knowledge of Python programming and machine learning concepts.
This setup can be adapted for many other use cases, such as analyzing art collections, historical documents, or any large set of images where visual similarities are important.
Technology Stack: OCI Data Science
- Oracle Cloud Infrastructure (OCI) Data Science: All the data processing, model training, and clustering were performed using OCI’s Data Science service, which provides a robust environment for machine learning workflows.
- TensorFlow and Keras: These libraries were used to load and process the images using a pre-trained VGG16 model, which extracts deep features from the images.
- OpenCV: This library was used to automatically detect and crop the regions of interest (medallions and facemasks) in each image.
- Scikit-learn: The K-Means clustering algorithm from this library was applied to group the images based on their extracted features.
- Matplotlib: This was used to visualize the clusters and review the grouping of images.
Step-by-Step Walkthrough
1. Loading and Preprocessing the Images
The first step is to load the images and preprocess them. This involves resizing them to 224×224 pixels to match the input requirements of the pre-trained VGG16 model, which is used to extract deep features from the images.
from tensorflow.keras.applications.vgg16 import VGG16, preprocess_input
from tensorflow.keras.preprocessing import image
import numpy as np

# Load the pre-trained VGG16 model
model = VGG16(weights='imagenet', include_top=False, pooling='avg')

# Function to load and preprocess images
def load_and_preprocess_image(img_path):
    img = image.load_img(img_path, target_size=(224, 224))
    img_array = image.img_to_array(img)
    img_array = np.expand_dims(img_array, axis=0)
    img_array = preprocess_input(img_array)
    return img_array
This code initializes the VGG16 model and defines a function to load and preprocess images. The preprocess_input function standardizes the input images for better performance with the VGG16 model.
2. Automatic Cropping of Medallions and Facemasks
To focus on the medallions and facemasks, I used OpenCV’s HoughCircles method to detect circular shapes within the images. This technique automatically identifies the regions of interest, crops the images accordingly, and prepares them for clustering.
import cv2

# Function to load, crop, and preprocess the image
def load_preprocess_and_save_image(img_path, preprocessed_dir, img_name):
    original_img = cv2.imread(img_path)

    if original_img is None:
        print(f"Error loading image: {img_path}")
        return None

    gray = cv2.cvtColor(original_img, cv2.COLOR_BGR2GRAY)
    circles = cv2.HoughCircles(gray, cv2.HOUGH_GRADIENT, dp=1.2, minDist=100, param1=50, param2=30, minRadius=10, maxRadius=100)

    if circles is not None:
        circles = np.round(circles[0, :]).astype("int")
        x, y, r = circles[0]
        x_start = max(x - r, 0)
        y_start = max(y - r, 0)
        cropped_img = original_img[y_start:y_start + 2 * r, x_start:x_start + 2 * r]
    else:
        cropped_img = original_img

    cropped_img_resized = cv2.resize(cropped_img, (224, 224))
    cv2.imwrite(os.path.join(preprocessed_dir, img_name), cropped_img_resized)
    img_array = image.img_to_array(cropped_img_resized)
    img_array = np.expand_dims(img_array, axis=0)
    img_array = preprocess_input(img_array)

    return img_array
This function loads each image, converts it to grayscale, and detects circular shapes that likely represent the medallions or facemasks. If a circle is detected, the image is cropped to focus on this area; otherwise, the entire image is used. The cropped images are resized and saved for later use.
3. Clustering the Images
Once the images were processed, I used the K-Means clustering algorithm from Scikit-learn to group them based on the extracted features. This step helps identify patterns and similarities between different artifacts.
from sklearn.cluster import KMeans

# Function to extract features and cluster images
def extract_and_cluster_images(image_paths, num_clusters=5):
    features = []
    for img_path in image_paths:
        img_array = load_preprocess_and_save_image(img_path)
        feature = model.predict(img_array)
        features.append(feature.flatten())

    kmeans = KMeans(n_clusters=num_clusters, random_state=42)
    kmeans.fit(features)
    labels = kmeans.labels_

    return labelsp
This code extracts features from each preprocessed image using the VGG16 model and applies K-Means clustering to group the images. The number of clusters can be adjusted based on the specific needs of the analysis.
4. Visualizing and Reviewing the Results
After clustering, the images are saved into directories based on their cluster assignments. Both the original and preprocessed images are saved, allowing the museum staff to review the grouped images and analyze the common features.
import shutil

def save_clustered_images(image_paths, labels, cluster_base_dir, preprocessed_images):
    for cluster_num in np.unique(labels):
        cluster_dir = os.path.join(cluster_base_dir, f'cluster_{cluster_num + 1}')
        os.makedirs(cluster_dir, exist_ok=True)
        for img_path in np.array(image_paths)[labels == cluster_num]:
            shutil.copy(img_path, cluster_dir)

            preprocessed_img = preprocessed_images[img_path]
            preprocessed_img_name = os.path.basename(img_path)
            preprocessed_save_path = os.path.join(cluster_dir, f'preprocessed_{preprocessed_img_name}')
            preprocessed_img = image.array_to_img(preprocessed_img)
            preprocessed_img.save(preprocessed_save_path)
This function organizes the images into folders based on their cluster labels. Each folder contains both the original images and the preprocessed ones, helping to understand the specific features that the clustering algorithm focused on.
Visual Results and Analysis
And here’s a visual representation of the clusters generated by the K-Means algorithm:
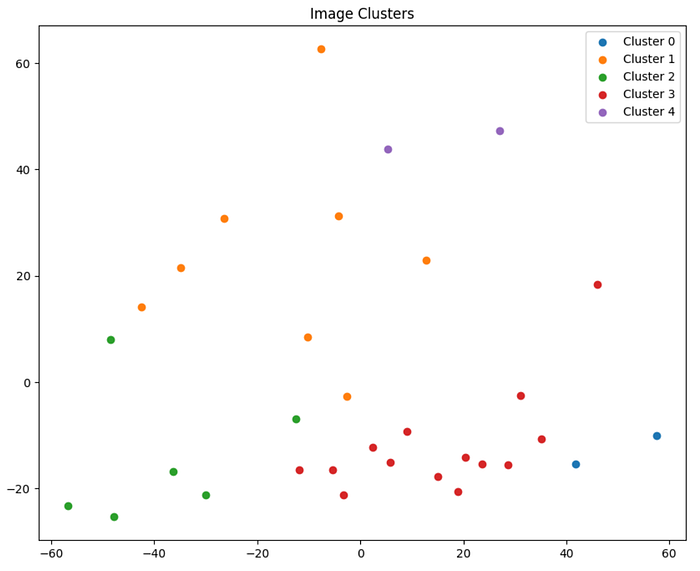
This scatter plot represents the clusters generated by the K-Means algorithm, with each color representing a different cluster:
As you can see, the images have been grouped into distinct clusters based on the features extracted from the medallions and facemasks. This visualization provides a clear overview of how the images are related to one another based on their visual similarities.
While these results are promising, it’s important to note that this analysis can be further refined and improved. For example, fine-tuning the parameters used in the image preprocessing and clustering steps could lead to more precise groupings. Additionally, incorporating more advanced techniques such as deep learning-based object detection could enhance the accuracy of the cropping process.
Next Steps: Oracle APEX Integration
The next step in this project is to develop an Oracle APEX application that will integrate with the OCI Data Science pipeline. This application will provide a graphical interface for uploading images, processing them, and visualizing the clustering results. The goal is to make this powerful tool accessible to curators and researchers who may not have a technical background, enabling them to easily interact with and analyze the data.
Conclusion
This project demonstrates how machine learning and image processing can be applied to uncover hidden patterns in large collections of digital images. While this case focused on a museum’s collection, the techniques used are applicable to a wide range of use cases, including art collections, historical documents, and more.
I’ve included two Jupyter notebooks on my GitHub repository for you to explore: one for clustering with the original images and another for clustering with the preprocessed images.
Feel free to follow me on LinkedIn for updates on this project and other related work. You can also contact me there if you have any questions or would like to discuss potential collaborations!
Stay tuned for the upcoming Oracle APEX application, and thank you for your interest. Happy coding! 🙂